 In late October the American Society of Nephrology (ASN) meeting returned to San Diego. Thousands of renal folks from around the world flooded the convention center and spilled out to walk along the sunny sidewalk by San Diego Bay. Dockless electric scooters were the craze outside of the conference. Based on my casual data collection there was an even split between cautious nephrologists who couldn’t believe anyone in their right mind would ride one of those things, especially without a helmet, and the wild-and-crazy nephrologists who immediately downloaded the app and hopped on board. I will not divulge where I stand on that great divide!
Inside the convention center things were more staid with the usual plenary extravaganza, exhibit hall excitement, poster presentations, and a vast array of small break-out sessions. I attended some informative and interesting sessions, but one of my favorites was “Monitoring Kidney Disease Around the World.” Hands down one of the best talks of the conference was given by Dr. John Stanifer from the Duke Global Health Institute who presented “CKD epidemiology in Sub-Saharan Africa,” but that is a blog post for another day.
Data in a “Learning Loop”
Of interest closer to home was the presentation by USRDS Coordinating Center Director Dr. Rajiv Saran who talked about “U.S. Surveillance Efforts for Kidney Disease.” Dr. Saran is part of the team that produces the USRDS Annual Data Report and his presentation covered the role of data in transforming healthcare. He works with the Michigan Department of Learning Health Sciences which operates on a “Learning Loop” framework that looks something like this:

The “Learning Loop” includes using data to gain insights, translating those insights into clinical interventions, and using new data collected during clinical delivery to assess performance. Performance data then restarts the iterative cycle to provide new knowledge to drive clinical improvement.
Big picture data
Big Data has influenced dialysis care since the 1970s as described in a recent AJKD article, “The Role of Big Data in the Development and Evaluation of U.S. Dialysis Care.” In 1977 the Health Care Financing Administration (HCFA) began monitoring dialysis claims data to track cost trends and patient access to care. The Omnibus Budget Reconciliation Act of 1986 mandated establishment of a “National ESRD Registry” to gain data insights into key aspects of the dialysis delivery system including:
- Economic impact and cost effectiveness of dialysis modalities
- Epidemiologic trends
- Resource allocation
In 1988 the U.S. Renal Data System (USRDS) registry was established to meet the national registry requirement. The USRDS Coordinating Center published the first ESRD Annual Data Report (ADR) in 1994 and the ADR remains a comprehensive data source for assessment of pre-dialysis CKD and dialysis performance.
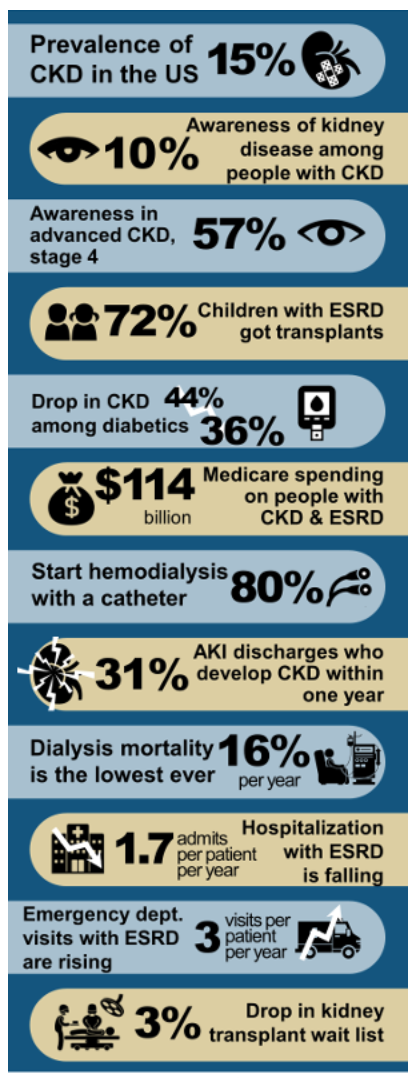
If you are too pressed for time to peruse the newly published USRDS 2018 ADR, there’s good news! Dr. Joel Topf assisted the USRDS team in creating a pretty fantastic infographic that conveys data highlights at a glance:
Dialysis-related performance data is not only for insight, but also for reimbursement as part of the legislatively mandated ESRD Pay-for-Performance (P4P) programs. Over a decade ago, CMS created an additional clinical ESRD data registry through the Consolidated Renal Operations in a Web-Enabled Network (CROWNWeb). All dialysis facilities provide clinical data to this registry either by manual data entry or through batch data transfers. CROWNWeb data is the data source for the ESRD Quality Improvement Program (QIP), which is a P4P program that implements pay reductions for poor performance. CROWNWeb also feeds clinical data to Dialysis Facility Compare and Five Star.
An incomplete data picture
As I’m sure you’ve experienced and as noted in the AJKD article, claims data—even when supplemented by clinical data—misses “subtle clinical findings” that influence clinician treatment decisions. The AJKD authors note that qualitative data such as patient experience of care is often missing in big administrative datasets and is, therefore, unaccounted for in determining and rewarding performance. An example cited in the article is that QIP performance may be poorer for dialysis facilities taking care of higher-risk patient groups, which may lead to unfair payment penalties.
All of this gets us back to the “Learning Loop.” Data provides valuable insights for designing and refining clinical interventions. In our EHR era, clinical data added to other datasets provides some performance measures which are used today for financial rewards and penalties. Even the big datasets at our disposal are missing key qualitative patient outcomes and patient population nuances that can hopefully be accounted for in future performance measures. Performance data should continue to provide insights that refine clinical service delivery. And so, the beat goes on.
 Dugan Maddux, MD, FACP, is the Vice President for CKD Initiatives for FMC-NA. Before her foray into the business side of medicine, Dr. Maddux spent 18 years practicing nephrology in Danville, Virginia. During this time, she and her husband, Dr. Frank Maddux, developed a nephrology-focused Electronic Health Record. She and Frank also developed Voice Expeditions, which features the Nephrology Oral History project, a collection of interviews of the early dialysis pioneers.


Leave a Reply