As July comes to a close we find ourselves two and a half years into the CMS EHR Incentive program. Recently the Secretary of the HHS let us know that over half of the docs and 80% of the hospitals in this country have demonstrated meaningful use. Through the end of June, just north of $15 billion dollars in incentives had been paid as part of the program. But the most remarkable sign of the times may be an article published last week in the Annals of Internal Medicine.
I remember my first exposure to the Annals as a young internal medicine intern in Dallas. This was one of the journals in a select group that youngsters in the medical field considered “hallowed ground.” Truly a sign of the times when an article about EHR costs makes its way into a peer reviewed journal such as the Annals.
The study
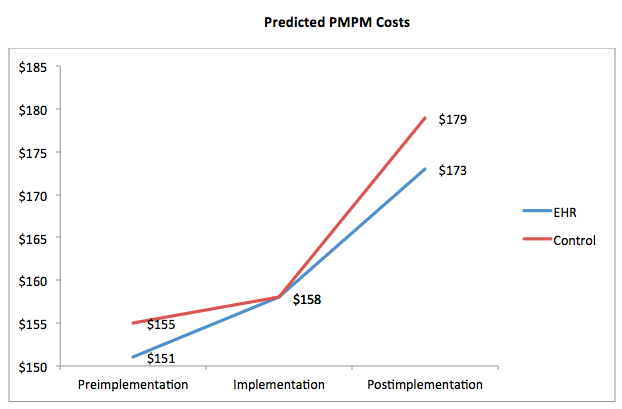
Cutting to the chase, “Effect of Electronic Health Records on Health Care Costs: Longitudinal Comparative Evidence from Community Practices” by Dr. Julia Adler-Milstein and associates identifies a modest reduction in ambulatory healthcare costs in communities where EHRs were adopted. I’ve reproduced the sentinel finding in the line graph below. Please note the x-axis is a bit misleading as the figures are not discrete points in time.
What’s fascinating is not so much the results, but how the authors conducted the study. “Fascinating” may be a bit of a stretch (the heat index here in Southside Virginia has been north of 100 recently and perhaps the weather has affected my judgment). Nonetheless, let’s take a closer look at what they did.
MAeHC EHR pilot
The Massachusetts eHealth Collaborative (MAeHC) screened 32 communities across the state around 2005 and ultimately selected three to participate in an EHR pilot. Practices in the three pilot communities were offered a choice of four widely utilized ambulatory EHRs and MAeHC covered the purchase and implementation costs for the practices (sweet deal if you can find it). 86% of the practices in these three communities took MAeHC up on their offer. MAeHC implemented the EHRs the practices selected between March 2006 and December 2007.
A deeper dive
The authors of this study examined several characteristics of each of the three pilot communities then identified two controls for each community among the 29 communities who originally applied to participate but were not selected. These nine communities (the three pilots and six controls) set the stage for what the authors appropriately describe as a “natural experiment in community practices.”
Costs displayed in the line graph above reflect total per member per month costs (inpatient and outpatient) and are based on normalized claims data. The graph identifies trended costs in the 15 months before implementation, at the start of implementation, and during the 18 months post implementation. Patients were attributed to a community if more than half of their outpatient costs were billed by providers within that community. If this sounds familiar it’s because it is very similar to the attribution models in play today for ACOs and the Physician Value-Based Payment Modifier.
Application to nephrology
How applicable is this study to nephrology? At first blush, not very. This was a relatively young population with little comorbidity. Almost 60% were HMO patients. From a financial perspective alone one can readily see the difference. While this group’s PMPM expense stayed below $200 per month, this figure for the typical in-center hemodialysis patient is in the range of $6,000-7,000 per month. Of course it’s easy to criticize the study from the comfort of an armchair (or sofa, as the case may be). The take-home for nephrologists is the perspective and the technique.
This is rigorous review. Total costs (inpatient, outpatient, pharma, lab, radiology, etc.) were standardized using claims data. Trends were interrogated using sophisticated regression models. Notice the perspective this study takes. It is from the vantage point of the purchaser of the delivered care. In this case, the commercial payer. Buried in the body of the paper is an interesting view of what the realized 3% savings might mean: “Assuming $5.14 PMPM savings for the 47,979 intervention patients (those in the pilot communities), it would take approximately 7 years to recoup the projected 5-year adoption costs in the pilot communities of $103,822 per provider.”
The value equation
The only thing missing in my view (also identified in Dr. Rainu Kaushal’s editorial that accompanied the article) is a measure of quality. Let’s not forget our old friend the healthcare value equation:
Value = Quality ÷ Cost
This study does a magnificent job with the denominator, but without a numerator our interpretation suffers. While costs went down, we are unable to determine if the value delivered by this intervention (adopting an EHR) increased. As the ACO market matures and as we are exposed to the Physician Value-Based Payment Modifier, we will increasingly need to think of quality as a function of cost. What is the value delivered? Did you have a chance to see this article? If so, send us a comment, let us know what you think.


Leave a Reply